Now that 2025 is over, it’s time to look back and feel proud of the path we’ve walked. Last year has been really exciting in terms of contributions to GStreamer and WebKit for the Igalia Multimedia team.
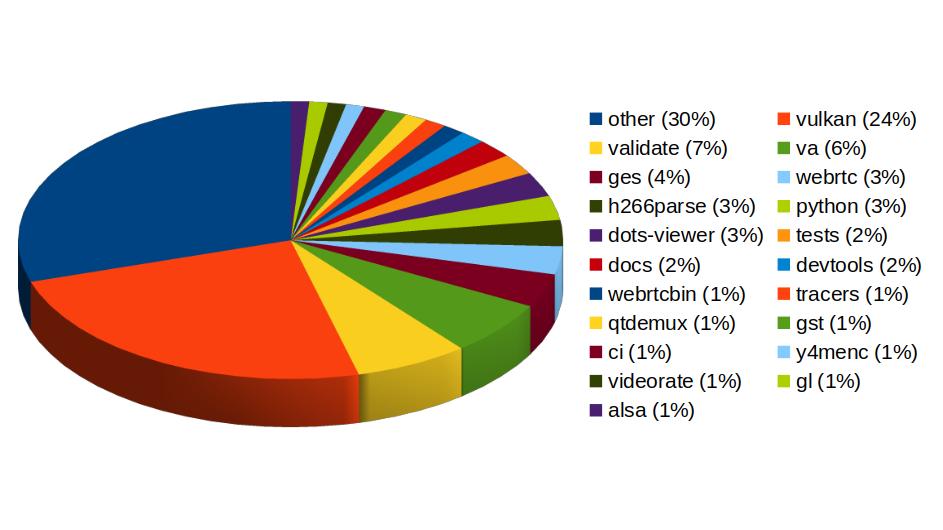
With more than 459 contributions along the year, we’ve been one of the top contributors to the GStreamer project, in areas like Vulkan Video, GstValidate, VA, GStreamer Editing Services, WebRTC or H.266 support.
Igalia’s contributions to the GStreamer project
In Vulkan Video we’ve worked on the VP9 video decoder, and cooperated with other contributors to push the AV1 decoder as well. There’s now an H.264 base class for video encoding that is designed to support general hardware-accelerated processing.
GStreaming Editing Services, the framework to build video editing applications, has gained time remapping support, which now allows to include fast/slow motion effects in the videos. Video transformations (scaling, cropping, rounded corners, etc) are now hardware-accelerated thanks to the addition of new Skia-based GStreamer elements and integration with OpenGL. Buffer pool tuning and pipeline improvements have helped to optimize memory usage and performance, enabling the edition of 4K video at 60 frames per second. Much of this work to improve and ensure quality in GStreamer Editing Services has also brought improvements in the GstValidate testing framework, which will be useful for other parts of GStreamer.
Regarding H.266 (VVC), full playback support (with decoders such as vvdec and avdec_h266, demuxers and muxers for Matroska, MP4 and TS, and parsers for the vvc1 and vvi1 formats) is now available in GStreamer 1.26 thanks to Igalia’s work. This allows user applications such as the WebKitGTK web browser to leverage the hardware accelerated decoding provided by VAAPI to play H.266 video using GStreamer.
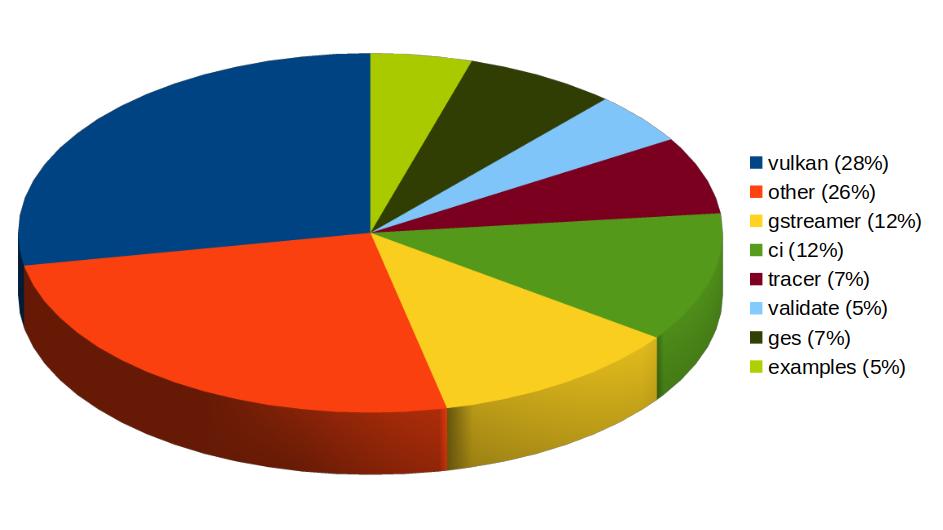
Igalia has also been one of the top contributors to GStreamer Rust, with 43 contributions. Most of the commits there have been related to Vulkan Video.
Igalia’s contributions to the GStreamer Rust project
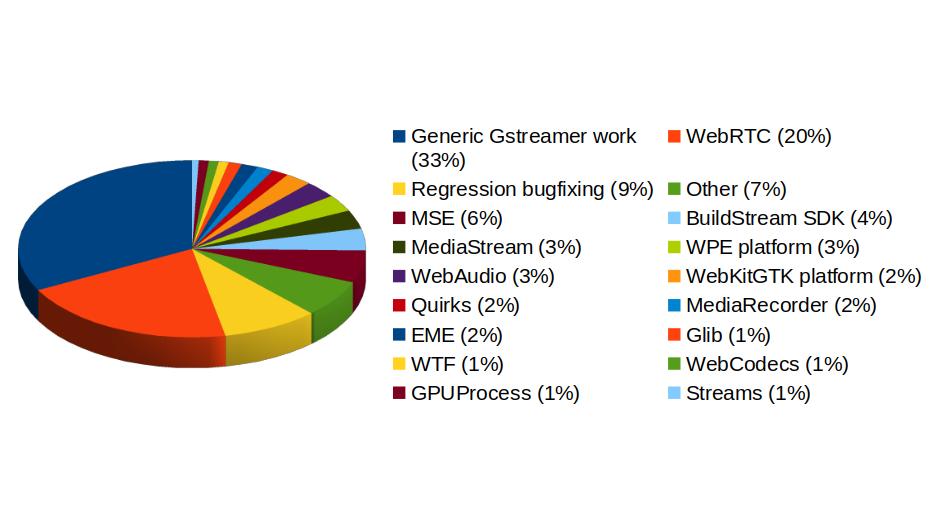
In addition to GStreamer, the team also has a strong presence in WebKit, where we leverage our GStreamer knowledge to implement many features of the web engine related to multimedia. From the 1739 contributions to the WebKit project done last year by Igalia, the Multimedia team has made 323 of them. Nearly one third of those have been related to generic multimedia playback, and the rest have been on areas such as WebRTC, MediaStream, MSE, WebAudio, a new Quirks system to provide adaptations for specific hardware multimedia platforms at runtime, WebCodecs or MediaRecorder.
Igalia Multimedia Team’s contributions to different areas of the WebKit project
We’re happy about what we’ve achieved along the year and look forward to maintaining this success and bringing even more exciting features and contributions in 2026.
Some years ago I had mentioned some command line tools I used to analyze and find useful information on GStreamer logs. I’ve been using them consistently along all these years, but some weeks ago I thought about unifying them in a single tool that could provide more flexibility in the mid term, and also as an excuse to unrust my Rust knowledge a bit. That’s how I wrote Meow, a tool to make cat speak (that is, to provide meaningful information).
The idea is that you can cat a file through meow and apply the filters, like this:
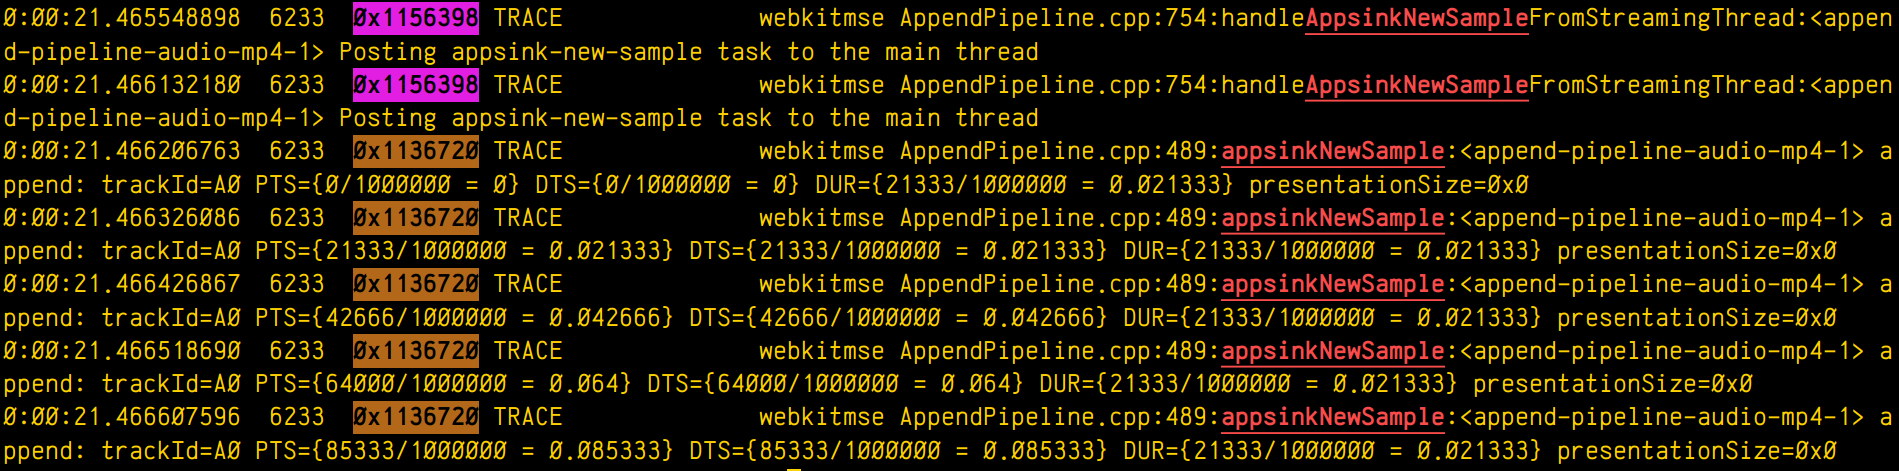
which means “select those lines that contain appsinknewsample (with case insensitive matching), but don’t contain V0 nor video (that is, by exclusion, only that contain audio, probably because we’ve analyzed both and realized that we should focus on audio for our specific problem), highlight the different thread ids, only show those lines with timestamp lower than 21.46 sec, and change strings like Source/WebCore/platform/graphics/gstreamer/mse/AppendPipeline.cpp to become just AppendPipeline.cpp“, to get an output as shown in this terminal screenshot:
Cool, isn’t it? After all, I’m convinced that the answer to any GStreamer bug is always hidden in the logs (or will be, as soon as I add “just a couple of log lines more, bro” 🤭).
Currently, meow supports this set of manipulation commands:
Word filter and highlighting by regular expression (fc:REGEX, or just REGEX): Every expression will highlight its matched words in a different color.
Filtering without highlighting (fn:REGEX): Same as fc:, but without highlighting the matched string. This is useful for those times when you want to match lines that have two expressions (E1, E2) but the highlighting would pollute the line too much. In those case you can use a regex such as E1.*E2 and then highlight the subexpressions manually later with an h: rule.
Negative filter (n:REGEX): Selects only the lines that don’t match the regex filter. No highlighting.
Highlight with no filter (h:REGEX): Doesn’t discard any line, just highlights the specified regex.
Substitution (s:/REGEX/REPLACE): Replaces one pattern for another. Any other delimiter character can be used instead of /, it that’s more convenient to the user (for instance, using # when dealing with expressions to manipulate paths).
Time filter (ft:TIME-TIME): Assuming the lines start with a GStreamer log timestamp, this filter selects only the lines between the target start and end time. Any of the time arguments (or both) can be omitted, but the - delimiter must be present. Specifying multiple time filters will generate matches that fit on any of the time ranges, but overlapping ranges can trigger undefined behaviour.
Highlight threads (ht:): Assuming a GStreamer log, where the thread id appears as the third word in the line, highlights each thread in a different color.
The REGEX pattern is a regular expression. All the matches are case insensitive. When used for substitutions, capture groups can be defined as (?CAPTURE_NAMEREGEX).
The REPLACEment string is the text that the REGEX will be replaced by when doing substitutions. Text captured by a named capture group can be referred to by ${CAPTURE_NAME}.
The TIME pattern can be any sequence of numbers, : or . . Typically, it will be a GStreamer timestamp (eg: 0:01:10.881123150), but it can actually be any other numerical sequence. Times are compared lexicographically, so it’s important that all of them have the same string length.
The filtering algorithm has a custom set of priorities for operations, so that they get executed in an intuitive order. For instance, a sequence of filter matching expressions (fc:, fn:) will have the same priority (that is, any of them will let a text line pass if it matches, not forbidding any of the lines already allowed by sibling expressions), while a negative filter will only be applied on the results left by the sequence of filters before it. Substitutions will be applied at their specific position (not before or after), and will therefore modify the line in a way that can alter the matching of subsequent filters. In general, the user doesn’t have to worry about any of this, because the rules are designed to generate the result that you would expect.
Now some practical examples:
Example 1: Select lines with the word “one”, or the word “orange”, or a number, highlighting each pattern in a different color except the number, which will have no color:
$ cat file.txt | meow one fc:orange 'fn:[0-9][0-9]*'
000 one small orange
005 one big orange
Example 2: Assuming a pictures filename listing, select filenames not ending in “jpg” nor in “jpeg”, and rename the filename to “.bak”, preserving the extension at the end:
Example 3: Only print the log lines with times between 0:00:24.787450146 and 0:00:24.790741865 or those at 0:00:30.492576587 or after, and highlight every thread in a different color:
This is only the begining. I have great ideas for this new tool (as time allows), such as support for parenthesis (so the expressions can be grouped), or call stack indentation on logs generated by tracers, in a similar way to what Alicia’s gst-log-indent-tracers tool does. I might also predefine some common expressions to use in regular expressions, such as the ones to match paths (so that the user doesn’t have to think about them and reinvent the wheel every time). Anyway, these are only ideas. Only time and hyperfocus slots will tell…
The <video> element implementation in WebKit does its job by using a multiplatform player that relies on a platform-specific implementation. In the specific case of glib platforms, which base their multimedia on GStreamer, that’s MediaPlayerPrivateGStreamer.
The player private can have 3 buffering modes:
On-disk buffering: This is the typical mode on desktop systems, but is frequently disabled on purpose on embedded devices to avoid wearing out their flash storage memories. All the video content is downloaded to disk, and the buffering percentage refers to the total size of the video. A GstDownloader element is present in the pipeline in this case. Buffering level monitoring is done by polling the pipeline every second, using the fillTimerFired() method.
In-memory buffering: This is the typical mode on embedded systems and on desktop systems in case of streamed (live) content. The video is downloaded progressively and only the part of it ahead of the current playback time is buffered. A GstQueue2 element is present in the pipeline in this case. Buffering level monitoring is done by listening to GST_MESSAGE_BUFFERING bus messages and using the buffering level stored on them. This is the case that motivates the refactoring described in this blog post, what we actually wanted to correct in Broadcom platforms, and what motivated the addition of hysteresis working on all the platforms.
Local files: Files, MediaStream sources and other special origins of video don’t do buffering at all (no GstDownloadBuffering nor GstQueue2 element is present on the pipeline). They work like the on-disk buffering mode in the sense that fillTimerFired() is used, but the reported level is relative, much like in the streaming case. In the initial version of the refactoring I was unaware of this third case, and only realized about it when tests triggered the assert that I added to ensure that the on-disk buffering method was working in GST_BUFFERING_DOWNLOAD mode.
The current implementation (actually, its wpe-2.38 version) was showing some buffering problems on some Broadcom platforms when doing in-memory buffering. The buffering levels monitored by MediaPlayerPrivateGStreamer weren’t accurate because the Nexus multimedia subsystem used on Broadcom platforms was doing its own internal buffering. Data wasn’t being accumulated in the GstQueue2 element of playbin, because BrcmAudFilter/BrcmVidFilter was accepting all the buffers that the queue could provide. Because of that, the player private buffering logic was erratic, leading to many transitions between “buffer completely empty” and “buffer completely full”. This, it turn, caused many transitions between the HaveEnoughData, HaveFutureData and HaveCurrentData readyStates in the player, leading to frequent pauses and unpauses on Broadcom platforms.
So, one of the first thing I tried to solve this issue was to ask the Nexus PlayPump (the subsystem in charge of internal buffering in Nexus) about its internal levels, and add that to the levels reported by GstQueue2. There’s also a GstMultiqueue in the pipeline that can hold a significant amount of buffers, so I also asked it for its level. Still, the buffering level unstability was too high, so I added a moving average implementation to try to smooth it.
All these tweaks only make sense on Broadcom platforms, so they were guarded by ifdefs in a first version of the patch. Later, I migrated those dirty ifdefs to the new quirks abstraction added by Phil. A challenge of this migration was that I needed to store some attributes that were considered part of MediaPlayerPrivateGStreamer before. They still had to be somehow linked to the player private but only accessible by the platform specific code of the quirks. A special HashMap attribute stores those quirks attributes in an opaque way, so that only the specific quirk they belong to knows how to interpret them (using downcasting). I tried to use move semantics when storing the data, but was bitten by object slicing when trying to move instances of the superclass. In the end, moving the responsibility of creating the unique_ptr that stored the concrete subclass to the caller did the trick.
Even with all those changes, undesirable swings in the buffering level kept happening, and when doing a careful analysis of the causes I noticed that the monitoring of the buffering level was being done from different places (in different moments) and sometimes the level was regarded as “enough” and the moment right after, as “insufficient”. This was because the buffering level threshold was one single value. That’s something that a hysteresis mechanism (with low and high watermarks) can solve. So, a logical level change to “full” would only happen when the level goes above the high watermark, and a logical level change to “low” when it goes under the low watermark level.
For the threshold change detection to work, we need to know the previous buffering level. There’s a problem, though: the current code checked the levels from several scattered places, so only one of those places (the first one that detected the threshold crossing at a given moment) would properly react. The other places would miss the detection and operate improperly, because the “previous buffering level value” had been overwritten with the new one when the evaluation had been done before. To solve this, I centralized the detection in a single place “per cycle” (in updateBufferingStatus()), and then used the detection conclusions from updateStates().
So, with all this in mind, I refactored the buffering logic as https://commits.webkit.org/284072@main, so now WebKit GStreamer has a buffering code much more robust than before. The unstabilities observed in Broadcom devices were gone and I could, at last, close Issue 1309.
Move semantics can be very useful to transfer ownership of resources, but as many other C++ features, it’s one more double edge sword that can harm yourself in new and interesting ways if you don’t read the small print.
For instance, if object moving involves super and subclasses, you have to keep an extra eye on what’s actually happening. Consider the following classes A and B, where the latter inherits from the former:
#include <stdio.h>
#include <utility>

#define PF printf("%s %p\n", __PRETTY_FUNCTION__, this)

class A {
 public:
 A() { PF; }
 virtual ~A() { PF; }
 A(A&& other)
 {
  PF;
  std::swap(i, other.i);
 }

 int i = 0;
};

class B : public A {
 public:
 B() { PF; }
 virtual ~B() { PF; }
 B(B&& other)
 {
  PF;
  std::swap(i, other.i);
  std::swap(j, other.j);
 }

 int j = 0;
};
If your project is complex, it would be natural that your code involves abstractions, with part of the responsibility held by the superclass, and some other part by the subclass. Consider also that some of that code in the superclass involves move semantics, so a subclass object must be moved to become a superclass object, then perform some action, and then moved back to become the subclass again. That’s a really bad idea!
Consider this usage of the classes defined before:
int main(int, char* argv[]) {
 printf("Creating B b1\n");
 B b1;
 b1.i = 1;
 b1.j = 2;
 printf("b1.i = %d\n", b1.i);
 printf("b1.j = %d\n", b1.j);
 printf("Moving (B)b1 to (A)a. Which move constructor will be used?\n");
 A a(std::move(b1));
 printf("a.i = %d\n", a.i);
 // This may be reading memory beyond the object boundaries, which may not be
 // obvious if you think that (A)a is sort of a (B)b1 in disguise, but it's not!
 printf("(B)a.j = %d\n", reinterpret_cast<B&>(a).j);
 printf("Moving (A)a to (B)b2. Which move constructor will be used?\n");
 B b2(reinterpret_cast<B&&>(std::move(a)));
 printf("b2.i = %d\n", b2.i);
 printf("b2.j = %d\n", b2.j);
 printf("^^^ Oops!! Somebody forgot to copy the j field when creating (A)a. Oh, wait... (A)a never had a j field in the first place\n");
 printf("Destroying b2, a, b1\n");
 return 0;
}
If you’ve read the code, those printfs will have already given you some hints about the harsh truth: if you move a subclass object to become a superclass object, you’re losing all the subclass specific data, because no matter if the original instance was one from a subclass, only the superclass move constructor will be used. And that’s bad, very bad. This problem is called object slicing. It’s specific to C++ and can also happen with copy constructors. See it with your own eyes:
Creating B b1
A::A() 0x7ffd544ca690
B::B() 0x7ffd544ca690
b1.i = 1
b1.j = 2
Moving (B)b1 to (A)a. Which move constructor will be used?
A::A(A&&) 0x7ffd544ca6a0
a.i = 1
(B)a.j = 0
Moving (A)a to (B)b2. Which move constructor will be used?
A::A() 0x7ffd544ca6b0
B::B(B&&) 0x7ffd544ca6b0
b2.i = 1
b2.j = 0
^^^ Oops!! Somebody forgot to copy the j field when creating (A)a. Oh, wait... (A)a never had a j field in the first place
Destroying b2, a, b1
virtual B::~B() 0x7ffd544ca6b0
virtual A::~A() 0x7ffd544ca6b0
virtual A::~A() 0x7ffd544ca6a0
virtual B::~B() 0x7ffd544ca690
virtual A::~A() 0x7ffd544ca690
Why can something that seems so obvious become such a problem, you may ask? Well, it depends on the context. It’s not unusual for the codebase of a long lived project to have started using raw pointers for everything, then switching to using references as a way to get rid of null pointer issues when possible, and finally switch to whole objects and copy/move semantics to get rid or pointer issues (references are just pointers in disguise after all, and there are ways to produce null and dangling references by mistake). But this last step of moving from references to copy/move semantics on whole objects comes with the small object slicing nuance explained in this post, and when the size and all the different things to have into account about the project steals your focus, it’s easy to forget about this.
So, please remember: never use move semantics that convert your precious subclass instance to a superclass instance thinking that the subclass data will survive. You can regret about it and create difficult to debug problems inadvertedly.
During all these years using GStreamer, I’ve been having to deal with GstSegments in many situations. I’ve always have had an intuitive understanding of the meaning of each field, but never had the time to properly write a good reference explanation for myself, ready to be checked at those times when the task at hand stops being so intuitive and nuisances start being important. I used the notes I took during an interesting conversation with Alba and Alicia about those nuisances, during the GStreamer Hackfest in A Coruña, as the seed that evolved into this post.
But what are actually GstSegments? They are the structures that track the values needed to synchronize the playback of a region of interest in a media file.
GstSegments are used to coordinate the translation between Presentation Timestamps (PTS), supplied by the media, and Runtime.
PTS is the timestamp that specifies, in buffer time, when the frame must be displayed on screen. This buffer time concept (called buffer running-time in the docs) refers to the ideal time flow where rate isn’t being had into account.
Decode Timestamp (DTS) is the timestamp that specifies, in buffer time, when the frame must be supplied to the decoder. On decoders supporting P-frames (forward-predicted) and B-frames (bi-directionally predicted), the PTS of the frames reaching the decoder may not be monotonic, but the PTS of the frames reaching the sinks are (the decoder outputs monotonic PTSs).
Runtime (called clock running time in the docs) is the amount of physical time that the pipeline has been playing back. More specifically, the Runtime of a specific frame indicates the physical time that has passed or must pass until that frame is displayed on screen. It starts from zero.
Base time is the point when the Runtime starts with respect to the input timestamp in buffer time (PTS or DTS). It’s the Runtime of the PTS=0.
Start, stop, duration: Those fields are buffer timestamps that specify when the piece of media that is going to be played starts, stops and how long that portion of the media is (the absolute difference between start and stop, and I mean absolute because a segment being played backwards may have a higher start buffer timestamp than what its stop buffer timestamp is).
Position is like the Runtime, but in buffer time. This means that in a video being played back at 2x, Runtime would flow at 1x (it’s physical time after all, and reality goes at 1x pace) and Position would flow at 2x (the video moves twice as fast than physical time).
The Stream Time is the position in the stream. Not exactly the same concept as buffer time. When handling multiple streams, some of them can be offset with respect to each other, not starting to be played from the begining, or even can have loops (eg: repeating the same sound clip from PTS=100 until PTS=200 intefinitely). In this case of repeating, the Stream time would flow from PTS=100 to PTS=200 and then go back again to the start position of the sound clip (PTS=100). There’s a nice graphic in the docs illustrating this, so I won’t repeat it here.
Time is the base of Stream Time. It’s the Stream time of the PTS of the first frame being played. In our previous example of the repeating sound clip, it would be 100.
There are also concepts such as Rate and Applied Rate, but we didn’t get into them during the discussion that motivated this post.
So, for translating between Buffer Time (PTS, DTS) and Runtime, we would apply this formula:
And for translating between Buffer Time (PTS, DTS) and Stream Time, we would apply this other formula:
StreamTime = BufferTime * AppliedRate + Time
And that’s it. I hope these notes in the shape of a post serve me as reference in the future. Again, thanks to Alicia, and especially to Alba, for the valuable clarifications during the discussion we had that day in the Igalia office. This post wouldn’t have been possible without them.
It’s been 8 years since the last time I wrote a videogame just for personal fun. As it’s now become a tradition, I took advantage of the extra focused personal time I usually have on the Christmas season and gave a try to Processing to do my own “advent of code”. It’s a programming environment based on Java that offers a similar visual, canvas-based experience to the one I enjoyed as a child in 8 bit computers. I certainly found coding there to be a pleasant and fun experience.
So, what I coded is called Cat’s Panic, my own version of a known arcade game with a similar name. In this version, the player has to unveil the outline of a hidden cute cat on each stage.
The player uses the arrow keys to control a cursor that can freely move inside a border line. When pressing space, the cursor can start an excursion to try to cover a new area of the image to be unveiled. If any of the enemies touches the excursion path, the player loses a life. The excursion can be canceled at any time by releasing the space key. Enemies can be killed by trapping them in a released area. A stage is completed when 85% of the outline is unveiled.
Although this game is released under GPLv2, I don’t recommend anybody to look at its source code. It breaks all principles of good software design, it’s messy, ugly, and it’s only purpose was to make the developing process entertaining for me. You’ve been warned.
I’m open to contributions in the way of new cat pictures that add more stages to the already existing ones, though.
I was a happy user of Del.icio.us for many years until the service closed. Then I moved my links to Google Bookmarks, which offered basically the same functionality (at least for my needs): link storage with title, tags and comments. I’ve carefully tagged and filed more than 2500 links since I started, and I’ve learnt to appreciate the usefulness of searching by tag to find again some precious information that was valuable to me in the past.
Google Bookmarks is a very old and simple service that “just works”. Sometimes it looked as if Google had just forgotten about it and let it run for years without anybody noticing… until now. It’s closing on September 2021.
I didn’t want to lose all my links, still need a link database searchable by tags and don’t want to be locked-in again in a similar service that might close in some years, so I wrote my own super-simple alternative to it. It’s called bs, sort of bookmark search.
The usage can’t be simpler, just add the tag you want to look for and it will print a list of links that have that tag:
$ bs webassembly
  title = Canvas filled three ways: JS, WebAssembly and WebGL | Compile
    url = https://compile.fi/canvas-filled-three-ways-js-webassembly-and-webgl/
   tags = canvas,graphics,html5,wasm,webassembly,webgl
   date = 2020-02-18 16:48:56
comment =

  title = Compiling to WebAssembly: It’s Happening! ★ Mozilla Hacks – the Web developer blog
    url = https://hacks.mozilla.org/2015/12/compiling-to-webassembly-its-happening/
   tags = asm.js,asmjs,emscripten,llvm,toolchain,web,webassembly
   date = 2015-12-18 09:14:35
comment =
If you call the tools without parameters, it will prompt data to insert a new link or edit it if the entered url matches a preexisting one:
$ bs
url: https://compile.fi/canvas-filled-three-ways-js-webassembly-and-webgl/
title: Canvas filled three ways: JS, WebAssembly and WebGL | Compile
tags: canvas,graphics,html5,wasm,webassembly,webgl
comment:
The data is stored in an sqlite database and I’ve written some JavaScript snippets to import the Delicious exported bookmarks file and the Google Bookmarks exported bookmarks file. Those snippets are meant to be copypasted in the JavaScript console of your browser while you have the exported bookmarks html file open on it. They’ll generate SQL sentences that will populate the database for the first time with your preexisting data.
By now the tool doesn’t allow to delete bookmarks (I haven’t had the need yet) and I still need to find a way to simplify its usage through the browser with a bookmarklet to ease adding new bookmarks automatically. But that’s a task for other day. By now I have enough just by knowing that my bookmarks are now safe.
Enjoy!
[UPDATE: 2020-09-08]
I’ve now coded an alternate variant of the database client that can be hosted on any web server with PHP and SQLite3. The bookmarks can now be managed from a browser in a centralized way, in a similar fashion as you could before with Google Bookmarks and Delicious. As you can see in the screenshot, the style resembles Google Bookmarks in some way.
You can easily create a quick search / search engine link in Firefox and Chrome (I use “d” as keyword, a tradition from the Delicious days, so that if I type “d debug” in the browser search bar it will look for that tag in the bookmark search page). Also, the 🔖 button opens a popup that shows a bookmarklet code that you can add to your browser bookmark bar. When you click on that bookmarklet, the edit page prefilled with the current page info is opened, so you can insert or edit a new entry.
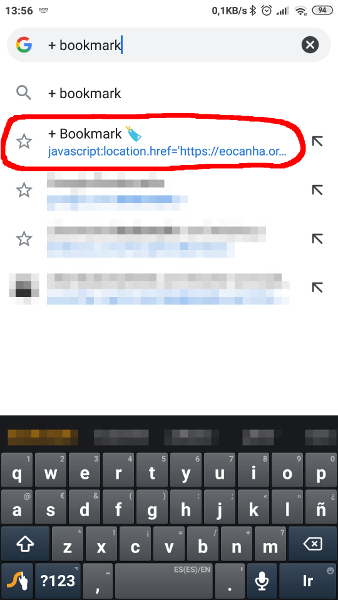
There’s a trick to use the bookmarklet on Android Chrome: Use a rare enough name for the bookmarklet (I used “+ Bookmark 🔖”). Then, when you want to add the current page to the webapp, just start typing “+ book”… in the search bar and the saved bookmarklet link will appear as an autocomplete option. Click on it and that’s it.
This is the last post of the series showing interesting debugging tools, I hope you have found it useful. Don’t miss the custom scripts at the bottom to process GStreamer logs, help you highlight the interesting parts and find the root cause of difficult bugs. Here are also the previous posts of the series:
This is useful to know why a particular package isn’t found and what are the default values for PKG_CONFIG_PATH when it’s not defined. For example:
Adding directory '/usr/local/lib/x86_64-linux-gnu/pkgconfig' from PKG_CONFIG_PATH
Adding directory '/usr/local/lib/pkgconfig' from PKG_CONFIG_PATH
Adding directory '/usr/local/share/pkgconfig' from PKG_CONFIG_PATH
Adding directory '/usr/lib/x86_64-linux-gnu/pkgconfig' from PKG_CONFIG_PATH
Adding directory '/usr/lib/pkgconfig' from PKG_CONFIG_PATH
Adding directory '/usr/share/pkgconfig' from PKG_CONFIG_PATH
If we have tuned PKG_CONFIG_PATH, maybe we also want to add the default paths. For example:
SYSROOT=~/sysroot-x86-64
export PKG_CONFIG_PATH=${SYSROOT}/usr/local/lib/pkgconfig:${SYSROOT}/usr/lib/pkgconfig
# Add also the standard pkg-config paths to find libraries in the system
export PKG_CONFIG_PATH=${PKG_CONFIG_PATH}:/usr/local/lib/x86_64-linux-gnu/pkgconfig:\
/usr/local/lib/pkgconfig:/usr/local/share/pkgconfig:/usr/lib/x86_64-linux-gnu/pkgconfig:\
/usr/lib/pkgconfig:/usr/share/pkgconfig
# This tells pkg-config where the "system" pkg-config dir is. This is useful when cross-compiling for other
# architecture, to avoid pkg-config using the system .pc files and mixing host and target libraries
export PKG_CONFIG_LIBDIR=${SYSROOT}/usr/lib
# This could have been used for cross compiling:
#export PKG_CONFIG_SYSROOT_DIR=${SYSROOT}
Man in the middle proxy for WebKit
Sometimes it’s useful to use our own modified/unminified files with a 3rd party service we don’t control. Mitmproxy can be used as a man-in-the-middle proxy, but I haven’t tried it personally yet. What I have tried (with WPE) is this:
Add an /etc/hosts entry to point the host serving the files we want to change to an IP address controlled by us.
Configure a web server to provide the files in the expected path.
:bulb: Pro tip: If you have to debug minified/obfuscated JavaScript code and don’t have a deobfuscated version to use in a man-in-the-middle fashion, use http://www.jsnice.org/ to deobfuscate it and get meaningful variable names.
Bandwidth control for a dependent device
If your computer has a “shared internet connection” enabled in Network Manager and provides access to a dependent device , you can control the bandwidth offered to that device. This is useful to trigger quality changes on adaptive streaming videos from services out of your control.
This can be done using tc, the Traffic Control tool from the Linux kernel. You can use this script to automate the process (edit it to suit to your needs).
Useful scripts to process GStreamer logs
I use these scripts in my daily job to look for strange patterns in GStreamer logs that help me to find the cause of the bugs I’m debugging:
h: Highlights each expression in the command line in a different color.
mgrep: Greps (only) for the lines with the expressions in the command line and highlights each expression in a different color.
filter-time: Gets a subset of the log lines between a start and (optionally) an end GStreamer log timestamp.
highlight-threads: Highlights each thread in a GStreamer log with a different color. That way it’s easier to follow a thread with the naked eye.
remove-ansi-colors: Removes the color codes from a colored GStreamer log.
aha: ANSI-HTML-Adapter converts plain text with color codes to HTML, so you can share your GStreamer logs from a web server (eg: for bug discussion). Available in most distros.
gstbuffer-leak-analyzer: Analyzes a GStreamer log and shows unbalances in the creation/destruction of GstBuffer and GstMemory objects.
In this new post series, I’ll show you how both existing and ad-hoc tools can be helpful to find the root cause of some problems. Here are also the older posts of this series in case you find them useful:
Use strace to know which config/library files are used by a program
If you’re becoming crazy supposing that the program should use some config and it seems to ignore it, just use strace to check what config files, libraries or other kind of files is the program actually using. Use the grep rules you need to refine the search:
First, try to strace -e trace=signal -p 1234 the killed process.
If that doesn’t work (eg: because it’s being killed with the uncatchable SIGKILL signal), then you can resort to modifying the kernel source code (signal.c) to log the calls to kill():
If you ever find yourself with little time in front of a stubborn build system and, no matter what you try, you can’t get the right flags to the compiler, think about putting something (a wrapper) between the build system and the compiler. Example for g++:
#!/bin/bash
main() {
    # Build up arg[] array with all options to be passed
    # to subcommand.
    i=0
    for opt in "$@"; do
        case "$opt" in
        -O2) ;; # Removes this option
        *)
            arg[i]="$opt" # Keeps the others
            i=$((i+1))
            ;;
        esac
    done
    EXTRA_FLAGS="-O0" # Adds extra option
    echo "g++ ${EXTRA_FLAGS} ${arg[@]}" # >> /tmp/build.log # Logs the command
    /usr/bin/ccache g++ ${EXTRA_FLAGS} "${arg[@]}" # Runs the command
}
main "$@"
Make sure that the wrappers appear earlier than the real commands in your PATH.
The make wrapper can also call remake instead. Remake is fully compatible with make but has features to help debugging compilation and makefile errors.
The source code shown below must be placed in the .h where the class to be debugged is defined. It’s written in a way that doesn’t need to rebuild RefCounted.h, so it saves a lot of build time. It logs all refs, unrefs and adoptPtrs, so that any anomaly in the refcounting can be traced and investigated later. To use it, just make your class inherit from LoggedRefCounted instead of RefCounted.
Example output:
void WTF::adopted(WTF::LoggedRefCounted<T>*) [with T = WebCore::MediaSourceClientGStreamerMSE]: this=0x673c07a4, refCount 1
void WTF::adopted(WTF::LoggedRefCounted<T>*) [with T = WebCore::MediaSourceClientGStreamerMSE]: this=0x673c07a4, refCount 1
^^^ Two adopts, this is not good.
void WTF::LoggedRefCounted<T>::ref() [with T = WebCore::MediaSourceClientGStreamerMSE]: this=0x673c07a4, refCount 1 --> ...
void WTF::LoggedRefCounted<T>::ref() [with T = WebCore::MediaSourceClientGStreamerMSE]: this=0x673c07a4, refCount ... --> 2
void WTF::LoggedRefCounted<T>::deref() [with T = WebCore::MediaSourceClientGStreamerMSE]: this=0x673c07a4, refCount 2 --> ...
void WTF::LoggedRefCounted<T>::deref() [with T = WebCore::MediaSourceClientGStreamerMSE]: this=0x673c07a4, refCount ... --> 1
void WTF::adopted(WTF::LoggedRefCounted<T>*) [with T = WebCore::MediaSourceClientGStreamerMSE]: this=0x673c07a4, refCount 1
void WTF::LoggedRefCounted<T>::deref() [with T = WebCore::MediaSourceClientGStreamerMSE]: this=0x673c07a4, refCount 1 --> ...
void WTF::LoggedRefCounted<T>::deref() [with T = WebCore::MediaSourceClientGStreamerMSE]: this=0x673c07a4, refCount 1 --> ...
^^^ Two recursive derefs, not good either.
It only works #if ENABLE(DEVELOPER_MODE), so you might want to remove those ifdefs if you’re building in Release mode.
Log tracers
In big pipelines (e.g. playbin) it can be very hard to find what element is replying to a query or handling an event. Even using gdb can be extremely tedious due to the very high level of recursion. My coworker Alicia commented that using log tracers is more helpful in this case.
GST_TRACERS=log enables additional GST_TRACE() calls all accross GStreamer. The following example logs entries and exits into the query function.
GST_TRACERS=log GST_DEBUG='query:TRACE'
The names of the logging categories are somewhat inconsistent:
log (the log tracer itself)
GST_BUFFER
GST_BUFFER_LIST
GST_EVENT
GST_MESSAGE
GST_STATES
GST_PADS
GST_ELEMENT_PADS
GST_ELEMENT_FACTORY
query
bin
The log tracer code is in subprojects/gstreamer/plugins/tracers/gstlog.c.