Now that 2025 is over, it’s time to look back and feel proud of the path we’ve walked. Last year has been really exciting in terms of contributions to GStreamer and WebKit for the Igalia Multimedia team.
With more than 459 contributions along the year, we’ve been one of the top contributors to the GStreamer project, in areas like Vulkan Video, GstValidate, VA, GStreamer Editing Services, WebRTC or H.266 support.
In Vulkan Video we’ve worked on the VP9 video decoder, and cooperated with other contributors to push the AV1 decoder as well. There’s now an H.264 base class for video encoding that is designed to support general hardware-accelerated processing.
GStreaming Editing Services, the framework to build video editing applications, has gained time remapping support, which now allows to include fast/slow motion effects in the videos. Video transformations (scaling, cropping, rounded corners, etc) are now hardware-accelerated thanks to the addition of new Skia-based GStreamer elements and integration with OpenGL. Buffer pool tuning and pipeline improvements have helped to optimize memory usage and performance, enabling the edition of 4K video at 60 frames per second. Much of this work to improve and ensure quality in GStreamer Editing Services has also brought improvements in the GstValidate testing framework, which will be useful for other parts of GStreamer.
Regarding H.266 (VVC), full playback support (with decoders such as vvdec and avdec_h266, demuxers and muxers for Matroska, MP4 and TS, and parsers for the vvc1 and vvi1 formats) is now available in GStreamer 1.26 thanks to Igalia’s work. This allows user applications such as the WebKitGTK web browser to leverage the hardware accelerated decoding provided by VAAPI to play H.266 video using GStreamer.
Igalia has also been one of the top contributors to GStreamer Rust, with 43 contributions. Most of the commits there have been related to Vulkan Video.
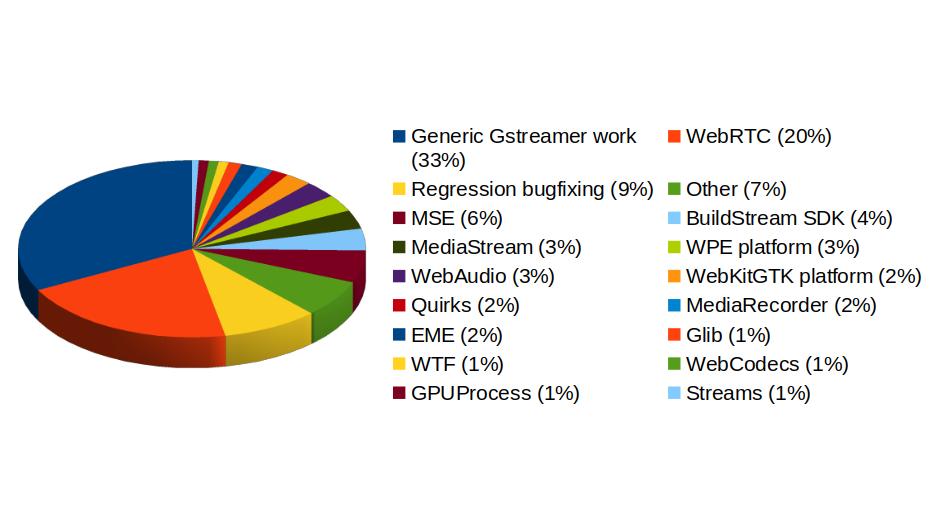
In addition to GStreamer, the team also has a strong presence in WebKit, where we leverage our GStreamer knowledge to implement many features of the web engine related to multimedia. From the 1739 contributions to the WebKit project done last year by Igalia, the Multimedia team has made 323 of them. Nearly one third of those have been related to generic multimedia playback, and the rest have been on areas such as WebRTC, MediaStream, MSE, WebAudio, a new Quirks system to provide adaptations for specific hardware multimedia platforms at runtime, WebCodecs or MediaRecorder.
We’re happy about what we’ve achieved along the year and look forward to maintaining this success and bringing even more exciting features and contributions in 2026.