During 2014 I started to become interested on how GStreamer was used in WebKit to play media content and how it was related to Media Source Extensions (MSE). Along 2015, my company Igalia strenghtened its cooperation with Metrological to enhance the multimedia support in their customized version of WebKitForWayland, the web platform they use for their products for the set-top box market. This was an opportunity to do really interesting things in the multimedia field on a really nice hardware platform: Raspberry Pi.
What are Media Source Extensions?
Normal URL playback in the <video> tag works by configuring the platform player (GStreamer in our case) with a source HTTP URL, so it behaves much like any other external player, downloading the content and showing it in a window. Special cases such as Dynamic Adaptive Streaming over HTTP (DASH) are automatically handled by the player, which becomes more complex. At the same time, the JavaScript code in the webpage has no way to know what’s happening with the quality changes in the stream.
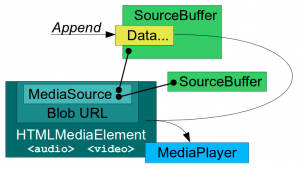
The MSE specification lets the authors move the responsibility to the JavaScript side in that kind of scenarios. A Blob object (Blob URL) can be configured to get its data from a MediaSource object. The MediaSource object can instantiate SourceBuffer objects. Video and Audio elements in the webpage can be configured with those Blob URLs. With this setup, JavaScript can manually feed binary data to the player by appending it to the SourceBuffer objects. The data is buffered and the playback time ranges generated by the data are accessible to JavaScript. The web page (and not the player) has now the control on the data being buffered, its quality, codec and procedence. Now it’s even possible to synthesize the media data programmatically if needed, opening the door to media editors and media effects coded in JavaScript.
MSE is being adopted by the main content broadcasters on the Internet. It’s required by YouTube for its dedicated interface for TV-like devices and they even have an MSE conformance test suite that hardware manufacturers wanting to get certified for that platform must pass.
MSE architecture in WebKit
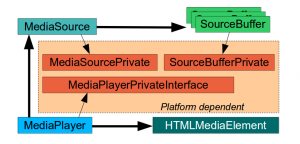
WebKit is a multiplatform framework with an end user API layer (WebKit2), an internal layer common to all platforms (WebCore) and particular implementations for each platform (GObject + GStreamer, in our case). Google and Apple have done a great work bringing MSE to WebKit. They have led the effort to implement the common WebCore abstractions needed to support MSE, such as MediaSource, SourceBuffer, MediaPlayer and the integration with HTMLMediaElement (video tag). They have also provided generic platform interfaces (MediaPlayerPrivateInterface, MediaSourcePrivate, SourceBufferPrivate) a working platform implementation for Mac OS X and a mock platform for testing.
The main contributions to the platform implementation for ports using GStreamer for media playback were done by Stephane Jadaud and Sebastian Dröge on bugs #99065 (initial implementation with hardcoded SourceBuffers for audio and video), #139441 (multiple SourceBuffers) and #140078 (support for tracks, more containers and encoding formats). This last patch hasn’t still been merged in trunk, but I used it as the starting point of the work to be done.
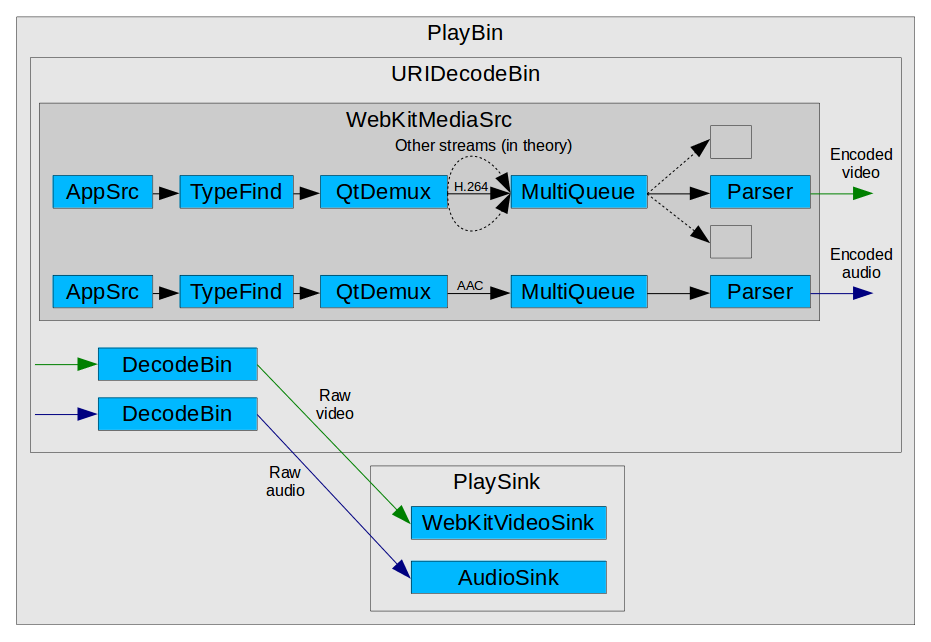
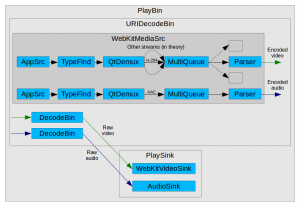
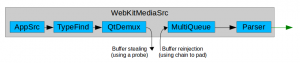
GStreamer, unlike other media frameworks, is strongly based on the concept of pipeline: the data traverses a series of linked elements (sources, demuxers, decoders, sinks) which process it in stages. At a given point in time, different pieces of data are in the pipeline at the same time in varying degrees of processing stages. In the case of MSE, a special WebKitMediaSrc GStreamer element is used as the data source in the pipeline and also serves as interface with the upper MSE layer, acting as client of MediaSource and SourceBuffer. WebKitMediaSrc is spawned by GstPlayBin (a container which manages everything automatically inside) when an MSE SourceBuffer is added to the MediaSource. The MediaSource is linked with the MediaPlayer, which has MediaPlayerPrivateGStreamer as private platform implementation. In the design we were using at that time, WebKitMediaSrc was responsible for demuxing the data appended on each SourceBuffer into several streams (I’ve never seen more than one stream per SourceBuffer, though) and for reporting the statistics and the samples themselves to the upper layer according to the MSE specs. To do that, the WebKitMediaSrc encapsulated an appsrc, a demuxer and a parser per source. The remaining pipeline elements after WebKitMediaSrc were in charge of decoding and playback.
Processing appends with GStreamer
The MSE implementation in Chromium uses a chunk demuxer to parse (demux) the data appended to the SourceBuffers. It keeps the parsing state and provides a self-contained way to perform the demuxing. Reusing that Chromium code would have been the easiest solution. However, GStreamer is a powerful media framework and we strongly believe that the demuxing stage can be done using GStreamer as part of the pipeline.
Because of the way GStreamer works, it’s easy to know when an element outputs new data but there’s no easy way to know when it has finished processing its input without discontinuing the flow with with End Of Stream (EOS) and effectively resetting the element. One simple approach that works is to use timeouts. If the demuxer doesn’t produce any output after a given time, we consider that the append has produced all the MediaSamples it could and therefore has finished. Two different timeouts were used: one to detect when appends that produce no samples have finished (noDataToDecodeTimeout) and another to detect when no more samples are coming (lastSampleToDecodeTimeout). The former needs to be longer than the latter.
Another technical challenge was to perform append processing when the pipeline isn’t playing. While playback doesn’t start, the pipeline just prerolls (is filled with the available data until the first frame can be rendered on the screen) and then pauses there until the continuous playback can start. However, the MSE spec expects the appended data to be completely processed and delivered to the upper MSE layer first, and then it’s up to JavaScript to decide if the playback on screen must start or not. The solution was to add intermediate queue elements with a very big capacity to force a preroll stage long enough for the probes in the demuxer source (output) pads to “see” all the samples pass beyond the demuxer. This was how the pipeline looked like at that time (see also the full dump):
While focusing on making the YouTube 2015 tests pass on our Raspberry Pi 1, we realized that the generated buffered ranges had strange micro-holes (eg: [0, 4.9998]; [5.0003, 10.0]) and that was confusing the tests. Definitely, there were differences of interpretation between ChunkDemuxer and qtdemux, but this is a minor problem which can be solved by adding some extra time ranges that fill the holes. All these changes got the append feature in good shape and the we could start watching videos more or less reliably on YouTube TV for the first time.
Basic seek support
Let’s focus on some real use case for a moment. The JavaScript code can be appending video data in the [20, 25] range, audio data in the [30, 35] range (because the [20, 30] range was appended before) and we’re still playing the [0, 5] range. Our previous design let the media buffers leave the demuxer and enter in the decoder without control. This worked nice for sequential playback, but was not compatible with non-linear playback (seeks). Feeding the decoder with video data for [0, 5] plus [20, 25] causes a big pause (while the timeline traverses [5, 20]) followed by a bunch of decoding errors (the decoder needs sequential data to work).
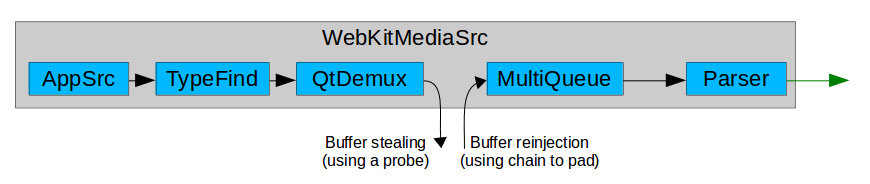
One possible improvement to support non-linear playback is to implement buffer stealing and buffer reinjecting at the demuxer output, so the buffers never go past that point without control. A probe steals the buffers, encapsulates them inside MediaSamples, pumps them to the upper MSE layer for storage and range reporting, and finally drops them at the GStreamer level. The buffers can be later reinjected by the enqueueSample() method when JavaScript decides to start the playback in the target position. The flushAndEnqueueNonDisplayingSamples() method reinjects auxiliary samples from before the target position just to help keeping the decoder sane and with the right internal state when the useful samples are inserted. You can see the dropping and reinjection points in the updated diagram:
The synchronization issues of managing several independent timelines at once must also be had into account. Each of the ongoing append and playback operations happen in their own timeline, but the pipeline is designed to be configured for a common playback segment. The playback state (READY, PAUSED, PLAYING), the flushes needed by the seek operation and the prerolls also affect all the pipeline elements. This problem can be minimized by manipulating the segments by hand to accomodate the different timings and by getting the help of very large queues to sustain the processing in the demuxer, even when the pipeline is still in pause. These changes can solve the issues and get the “47. Seek” test working, but YouTube TV is more demanding and requires a more structured design.
Divide and conquer
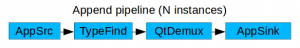
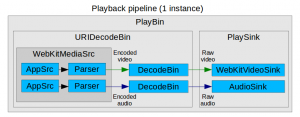
At this point we decided to simplify MediaPlayerPrivateGStreamer and refactor all the MSE logic into a new subclass called MediaPlayerPrivateGStreamerMSE. After that, the unified pipeline was split into N append pipelines (one per SourceBuffer) and one playback pipeline. This change solved the synchronization issues and splitted a complex problem into two simpler ones. The AppendPipeline class, visible only to the MSE private player, is in charge of managing all the append logic. There’s one instance for each of the N append pipelines.
Each append pipeline is created by hand. It contains an appsrc (to feed data into it), a typefinder, a qtdemuxer, optionally a decoder (in case we want to suport Encrypted Media Extensions too), and an appsink (to pick parsed data). In my willing to simplify, I removed the support for all formats except ISO MP4, the only one really needed for YouTube. The other containers could be reintroduced in the future.
The playback pipeline is what remains of the old unified pipeline, but simpler. It’s still based on playbin, and the main difference is that the WebKitMediaSrc is now simpler. It consists of N sources (one per SourceBuffer) composed by an appsrc (to feed buffered samples), a parser block and the src pads. Uridecodebin is in charge of instantiating it, like before. The PlaybackPipeline class was created to take care of some of the management logic.
The AppendPipeline class manages the callback forwarding between threads, using asserts to strongly enforce the access to WebCore MSE classes from the main thread. AtomicString and all the classes inheriting from RefCounted (instead of ThreadSafeRefCounted) can’t be safely managed from different threads. This includes most of the classes used in the MSE implementation. However, the demuxer probes and other callbacks sometimes happen in the streaming thread of the corresponding element, not in the main thread, so that’s why call forwarding must be done.
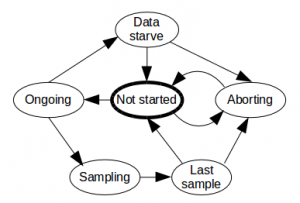
AppendPipeline also uses an internal state machine to manage the different stages of the append operation and all the actions relevant for each stage (starting/stopping the timeouts, process the samples, finish the appends and manage SourceBuffer aborts).
Seek support for the real world
With this new design, the use case of a typical seek works like this (very simplified):
- The video may be being currently played at some position (buffered, of course).
- The JavaScript code appends data for the new target position to each of the video/audio SourceBuffers. Each AppendPipeline processes the data and JavaScript is aware of the new buffered ranges.
- JavaScript seeks to the new position. This ends up calling the seek() and doSeek() methods.
- MediaPlayerPrivateGStreamerMSE instructs WebKitMediaSrc to stop accepting more samples until further notice and to prepare the seek (reset the seek-data and need-data counters). The player private performs the real GStreamer seek in the playback pipeline and leaves the rest of the seek pending for when WebKitMediaSrc is ready.
- The GStreamer seek causes some changes in the pipeline and eventually all the appsrc in WebKitMediaSrc emit the seek-data and need-data events. Then WebKitMediaSrc notifies the player private that it’s ready to accept samples for the target position and needs data. MediaSource is notified here to seek and this triggers the enqueuing of the new data (non displaying samples and visible ones).
- The pending seek at player private level which was pending from step 4 continues, giving permission to WebKitMediaSrc to accept samples again.
- Seek is completed. The samples enqueued in step 5 flow now through the playback pipeline and the user can see the video from the target position.
That was just the typical case, but more complex scenarios are also supported. This includes multiple seeks (pressing the forward/backward button several times), seeks to buffered areas (the easiest ones) and to unbuffered areas (where the seek sequence needs to wait until the data for the target area is appended and buffered).
Close cooperation from qtdemux is also required in order to get accurate presentation timestamps (PTS) for the processed media. We detected a special case when appending data much forward in the media stream during a seek. Qtdemux kept generating sequential presentation timestamps, completely ignoring the TFDT atom, which tells where the timestamps of the new data block must start. I had to add a new “always-honor-tfdt” attribute to qtdemux to solve that problem.
With all these changes the YouTube 2015 and 2016 tests are green for us and YouTube TV is completely functional on a Raspberry Pi 2.
Upstreaming the code during Web Engines Hackfest 2015
All this work is currently in the Metrological WebKitForWayland repository, but it could be a great upstream contribution. Last December I was invited to the Web Engines Hackfest 2015, an event hosted in Igalia premises in A Coruña (Spain). I attended with the intention of starting the upstreaming process of our MSE implementation for GStreamer, so other ports such as WebKitGTK+ and WebKitEFL could also benefit from it. Thanks a lot to our sponsors for making it possible.
At the end of the hackfest I managed to have something that builds in a private branch. I’m currently devoting some time to work on the regressions in the YouTube 2016 tests, clean unrelated EME stuff and adapt the code to the style guidelines. Eventually, I’m going to submit the patch for review on bugzilla. There are some topics that I’d like to discuss with other engineers as part of this process, such as the interpretation of the spec regarding how the ReadyState is computed.
In parallel to the upstreaming process, our plans for the future include getting rid of the append timeouts by finding a better alternative, improving append performance and testing seek even more thoroughly with other real use cases. In the long term we should add support for appendStream() and increase the set of supported media containers and codecs at least to webm and vp8.
Let’s keep hacking!