Beyond Google Bookmarks

I was a happy user of Del.icio.us for many years until the service closed. Then I moved my links to Google Bookmarks, which offered basically the same functionality (at least for my needs): link storage with title, tags and comments. I’ve carefully tagged and filed more than 2500 links since I started, and I’ve learnt to appreciate the usefulness of searching by tag to find again some precious information that was valuable to me in the past.

Google Bookmarks is a very old and simple service that “just works”. Sometimes it looked as if Google had just forgotten about it and let it run for years without anybody noticing… until now. It’s closing on September 2021.

I didn’t want to lose all my links, still need a link database searchable by tags and don’t want to be locked-in again in a similar service that might close in some years, so I wrote my own super-simple alternative to it. It’s called bs, sort of bookmark search.

The usage can’t be simpler, just add the tag you want to look for and it will print a list of links that have that tag:

$ bs webassembly
  title = Canvas filled three ways: JS, WebAssembly and WebGL | Compile 
    url = https://compile.fi/canvas-filled-three-ways-js-webassembly-and-webgl/ 
   tags = canvas,graphics,html5,wasm,webassembly,webgl 
   date = 2020-02-18 16:48:56 
comment =  
 
  title = Compiling to WebAssembly: It’s Happening! ★ Mozilla Hacks – the Web developer blog 
    url = https://hacks.mozilla.org/2015/12/compiling-to-webassembly-its-happening/ 
   tags = asm.js,asmjs,emscripten,llvm,toolchain,web,webassembly 
   date = 2015-12-18 09:14:35 
comment = 

If you call the tools without parameters, it will prompt data to insert a new link or edit it if the entered url matches a preexisting one:

$ bs 
url: https://compile.fi/canvas-filled-three-ways-js-webassembly-and-webgl/ 
title: Canvas filled three ways: JS, WebAssembly and WebGL | Compile 
tags: canvas,graphics,html5,wasm,webassembly,webgl 
comment: 

The data is stored in an sqlite database and I’ve written some JavaScript snippets to import the Delicious exported bookmarks file and the Google Bookmarks exported bookmarks file. Those snippets are meant to be copypasted in the JavaScript console of your browser while you have the exported bookmarks html file open on it. They’ll generate SQL sentences that will populate the database for the first time with your preexisting data.

By now the tool doesn’t allow to delete bookmarks (I haven’t had the need yet) and I still need to find a way to simplify its usage through the browser with a bookmarklet to ease adding new bookmarks automatically. But that’s a task for other day. By now I have enough just by knowing that my bookmarks are now safe.

Enjoy!

[UPDATE: 2020-09-08]

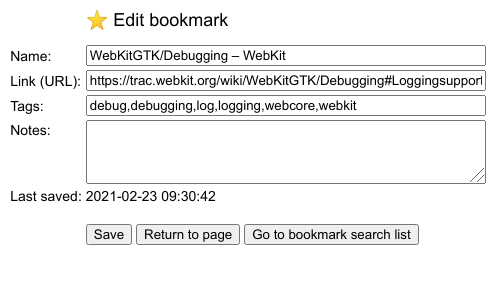
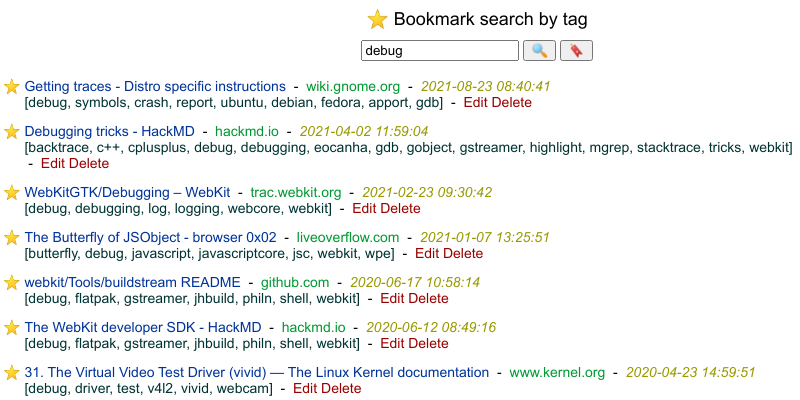
I’ve now coded an alternate variant of the database client that can be hosted on any web server with PHP and SQLite3. The bookmarks can now be managed from a browser in a centralized way, in a similar fashion as you could before with Google Bookmarks and Delicious. As you can see in the screenshot, the style resembles Google Bookmarks in some way.

You can easily create a quick search / search engine link in Firefox and Chrome (I use “d” as keyword, a tradition from the Delicious days, so that if I type “d debug” in the browser search bar it will look for that tag in the bookmark search page). Also, the 🔖 button opens a popup that shows a bookmarklet code that you can add to your browser bookmark bar. When you click on that bookmarklet, the edit page prefilled with the current page info is opened, so you can insert or edit a new entry.

There’s a trick to use the bookmarklet on Android Chrome: Use a rare enough name for the bookmarklet (I used “+ Bookmark 🔖”). Then, when you want to add the current page to the webapp, just start typing “+ book”… in the search bar and the saved bookmarklet link will appear as an autocomplete option. Click on it and that’s it.

Enjoy++!
GStreamer WebKit debugging by using external tools (2/2)

This is the last post of the series showing interesting debugging tools, I hope you have found it useful. Don’t miss the custom scripts at the bottom to process GStreamer logs, help you highlight the interesting parts and find the root cause of difficult bugs. Here are also the previous posts of the series:

How to debug pkgconfig

When pkg-config finds the PKG_CONFIG_DEBUG_SPEW env var, it explains all the steps used to resolve the packages:

PKG_CONFIG_DEBUG_SPEW=1 /usr/bin/pkg-config --libs x11

This is useful to know why a particular package isn’t found and what are the default values for PKG_CONFIG_PATH when it’s not defined. For example:

Adding directory '/usr/local/lib/x86_64-linux-gnu/pkgconfig' from PKG_CONFIG_PATH
Adding directory '/usr/local/lib/pkgconfig' from PKG_CONFIG_PATH
Adding directory '/usr/local/share/pkgconfig' from PKG_CONFIG_PATH
Adding directory '/usr/lib/x86_64-linux-gnu/pkgconfig' from PKG_CONFIG_PATH
Adding directory '/usr/lib/pkgconfig' from PKG_CONFIG_PATH
Adding directory '/usr/share/pkgconfig' from PKG_CONFIG_PATH

If we have tuned PKG_CONFIG_PATH, maybe we also want to add the default paths. For example:

SYSROOT=~/sysroot-x86-64
export PKG_CONFIG_PATH=${SYSROOT}/usr/local/lib/pkgconfig:${SYSROOT}/usr/lib/pkgconfig
# Add also the standard pkg-config paths to find libraries in the system
export PKG_CONFIG_PATH=${PKG_CONFIG_PATH}:/usr/local/lib/x86_64-linux-gnu/pkgconfig:\
/usr/local/lib/pkgconfig:/usr/local/share/pkgconfig:/usr/lib/x86_64-linux-gnu/pkgconfig:\
/usr/lib/pkgconfig:/usr/share/pkgconfig
# This tells pkg-config where the "system" pkg-config dir is. This is useful when cross-compiling for other
# architecture, to avoid pkg-config using the system .pc files and mixing host and target libraries
export PKG_CONFIG_LIBDIR=${SYSROOT}/usr/lib
# This could have been used for cross compiling:
#export PKG_CONFIG_SYSROOT_DIR=${SYSROOT}

Man in the middle proxy for WebKit

Sometimes it’s useful to use our own modified/unminified files with a 3rd party service we don’t control. Mitmproxy can be used as a man-in-the-middle proxy, but I haven’t tried it personally yet. What I have tried (with WPE) is this:

  1. Add an /etc/hosts entry to point the host serving the files we want to change to an IP address controlled by us.
  2. Configure a web server to provide the files in the expected path.
  3. Modify the ResourceRequestBase constructor to change the HTTPS requests to HTTP when the hostname matches the target:
ResourceRequestBase(const URL& url, ResourceRequestCachePolicy policy)
    : m_url(url)
    , m_timeoutInterval(s_defaultTimeoutInterval)
    ...
    , m_isAppBound(false)
{
    if (m_url.host().toStringWithoutCopying().containsIgnoringASCIICase(String("out-of-control-service.com"))
        && m_url.protocol().containsIgnoringASCIICase(String("https"))) {
        printf("### %s: URL %s detected, changing from https to http\n",
            __PRETTY_FUNCTION__, m_url.string().utf8().data()); 
        fflush(stdout);
        m_url.setProtocol(String("http"));
    }
}

:bulb: Pro tip: If you have to debug minified/obfuscated JavaScript code and don’t have a deobfuscated version to use in a man-in-the-middle fashion, use http://www.jsnice.org/ to deobfuscate it and get meaningful variable names.

Bandwidth control for a dependent device

If your computer has a “shared internet connection” enabled in Network Manager and provides access to a dependent device , you can control the bandwidth offered to that device. This is useful to trigger quality changes on adaptive streaming videos from services out of your control.

This can be done using tc, the Traffic Control tool from the Linux kernel. You can use this script to automate the process (edit it to suit to your needs).

Useful scripts to process GStreamer logs

I use these scripts in my daily job to look for strange patterns in GStreamer logs that help me to find the cause of the bugs I’m debugging:

  • h: Highlights each expression in the command line in a different color.
  • mgrep: Greps (only) for the lines with the expressions in the command line and highlights each expression in a different color.
  • filter-time: Gets a subset of the log lines between a start and (optionally) an end GStreamer log timestamp.
  • highlight-threads: Highlights each thread in a GStreamer log with a different color. That way it’s easier to follow a thread with the naked eye.
  • remove-ansi-colors: Removes the color codes from a colored GStreamer log.
  • aha: ANSI-HTML-Adapter converts plain text with color codes to HTML, so you can share your GStreamer logs from a web server (eg: for bug discussion). Available in most distros.
  • gstbuffer-leak-analyzer: Analyzes a GStreamer log and shows unbalances in the creation/destruction of GstBuffer and GstMemory objects.

GStreamer WebKit debugging by using external tools (1/2)

In this new post series, I’ll show you how both existing and ad-hoc tools can be helpful to find the root cause of some problems. Here are also the older posts of this series in case you find them useful:

Use strace to know which config/library files are used by a program

If you’re becoming crazy supposing that the program should use some config and it seems to ignore it, just use strace to check what config files, libraries or other kind of files is the program actually using. Use the grep rules you need to refine the search:

$ strace -f -e trace=%file nano 2> >(grep 'nanorc')
access("/etc/nanorc", R_OK)             = 0
access("/usr/share/nano/javascript.nanorc", R_OK) = 0
access("/usr/share/nano/gentoo.nanorc", R_OK) = 0
...

Know which process is killing another one

First, try to strace -e trace=signal -p 1234 the killed process.

If that doesn’t work (eg: because it’s being killed with the uncatchable SIGKILL signal), then you can resort to modifying the kernel source code (signal.c) to log the calls to kill():

SYSCALL_DEFINE2(kill, pid_t, pid, int, sig)
{
    struct task_struct *tsk_p;
    ...
    /* Log SIGKILL */
    if (sig & 0x1F == 9) {
        tsk_p = find_task_by_vpid(pid);

        if (tsk_p) {
            printk(KERN_DEBUG "Sig: %d from pid: %d (%s) to pid: %d (%s)\n",
                sig, current->pid, current->comm, pid, tsk_p->comm);
        } else {
            printk(KERN_DEBUG "Sig: %d from pid: %d (%s) to pid: %d\n",
                sig, current->pid, current->comm, pid);
        }
    }
    ...
}

Wrap gcc/ld/make to tweak build parameters

If you ever find yourself with little time in front of a stubborn build system and, no matter what you try, you can’t get the right flags to the compiler, think about putting something (a wrapper) between the build system and the compiler. Example for g++:

#!/bin/bash
main() {
    # Build up arg[] array with all options to be passed
    # to subcommand.
    i=0
    for opt in "$@"; do
        case "$opt" in
        -O2) ;; # Removes this option
        *)
            arg[i]="$opt" # Keeps the others
            i=$((i+1))
            ;;
        esac
    done
    EXTRA_FLAGS="-O0" # Adds extra option
    echo "g++ ${EXTRA_FLAGS} ${arg[@]}" # >> /tmp/build.log # Logs the command
    /usr/bin/ccache g++ ${EXTRA_FLAGS} "${arg[@]}" # Runs the command
}
main "$@"

Make sure that the wrappers appear earlier than the real commands in your PATH.

The make wrapper can also call remake instead. Remake is fully compatible with make but has features to help debugging compilation and makefile errors.

Analyze the structure of MP4 data

The ISOBMFF Box Structure Viewer online tool allows you to upload an MP4 file and explore its structure.

GStreamer WebKit debugging by instrumenting source code (3/3)

This is the last post on the instrumenting source code series. I hope you to find the tricks below as useful as the previous ones.

In this post I show some more useful debugging tricks. Don’t forget to have a look at the other posts of the series:

Finding memory leaks in a RefCounted subclass

The source code shown below must be placed in the .h where the class to be debugged is defined. It’s written in a way that doesn’t need to rebuild RefCounted.h, so it saves a lot of build time. It logs all refs, unrefs and adoptPtrs, so that any anomaly in the refcounting can be traced and investigated later. To use it, just make your class inherit from LoggedRefCounted instead of RefCounted.

Example output:

void WTF::adopted(WTF::LoggedRefCounted<T>*) [with T = WebCore::MediaSourceClientGStreamerMSE]: this=0x673c07a4, refCount 1
^^^ Two adopts, this is not good.
void WTF::LoggedRefCounted<T>::ref() [with T = WebCore::MediaSourceClientGStreamerMSE]: this=0x673c07a4, refCount 1 --> ...
void WTF::LoggedRefCounted<T>::ref() [with T = WebCore::MediaSourceClientGStreamerMSE]: this=0x673c07a4, refCount ... --> 2
void WTF::LoggedRefCounted<T>::deref() [with T = WebCore::MediaSourceClientGStreamerMSE]: this=0x673c07a4, refCount 2 --> ...
void WTF::LoggedRefCounted<T>::deref() [with T = WebCore::MediaSourceClientGStreamerMSE]: this=0x673c07a4, refCount ... --> 1
void WTF::adopted(WTF::LoggedRefCounted<T>*) [with T = WebCore::MediaSourceClientGStreamerMSE]: this=0x673c07a4, refCount 1
void WTF::LoggedRefCounted<T>::deref() [with T = WebCore::MediaSourceClientGStreamerMSE]: this=0x673c07a4, refCount 1 --> ...
^^^ Two recursive derefs, not good either.
#include "Logging.h"

namespace WTF {

template<typename T> class LoggedRefCounted : public WTF::RefCounted<T> {
    WTF_MAKE_NONCOPYABLE(LoggedRefCounted); WTF_MAKE_FAST_ALLOCATED;
public:
    void ref() {
        printf("%s: this=%p, refCount %d --> ...\n", __PRETTY_FUNCTION__, this, WTF::RefCounted<T>::refCount()); fflush(stdout);
        WTF::RefCounted<T>::ref();
        printf("%s: this=%p, refCount ... --> %d\n", __PRETTY_FUNCTION__, this, WTF::RefCounted<T>::refCount()); fflush(stdout);
    }

    void deref() {
        printf("%s: this=%p, refCount %d --> ...\n", __PRETTY_FUNCTION__, this, WTF::RefCounted<T>::refCount()); fflush(stdout);
        WTF::RefCounted<T>::deref();
        printf("%s: this=%p, refCount ... --> %d\n", __PRETTY_FUNCTION__, this, WTF::RefCounted<T>::refCount()); fflush(stdout);
    }

protected:
    LoggedRefCounted() { }
    ~LoggedRefCounted() { }
};

template<typename T> inline void adopted(WTF::LoggedRefCounted<T>* object)
{
    printf("%s: this=%p, refCount %d\n", __PRETTY_FUNCTION__, object, (object)?object->refCount():0); fflush(stdout);
    adopted(static_cast<RefCountedBase*>(object));
}

} // Namespace WTF

Pause WebProcess on launch

WebProcessMainGtk and WebProcessMainWPE will sleep for 30 seconds if a special environment variable is defined:

export WEBKIT2_PAUSE_WEB_PROCESS_ON_LAUNCH=1

It only works #if ENABLE(DEVELOPER_MODE), so you might want to remove those ifdefs if you’re building in Release mode.

Log tracers

In big pipelines (e.g. playbin) it can be very hard to find what element is replying to a query or handling an event. Even using gdb can be extremely tedious due to the very high level of recursion. My coworker Alicia commented that using log tracers is more helpful in this case.

GST_TRACERS=log enables additional GST_TRACE() calls all accross GStreamer. The following example logs entries and exits into the query function.

GST_TRACERS=log GST_DEBUG='query:TRACE'

The names of the logging categories are somewhat inconsistent:

  • log (the log tracer itself)
  • GST_BUFFER
  • GST_BUFFER_LIST
  • GST_EVENT
  • GST_MESSAGE
  • GST_STATES
  • GST_PADS
  • GST_ELEMENT_PADS
  • GST_ELEMENT_FACTORY
  • query
  • bin

The log tracer code is in subprojects/gstreamer/plugins/tracers/gstlog.c.

GStreamer WebKit debugging by instrumenting source code (2/3)

In this post I show some more useful debugging tricks. Check also the other posts of the series:

Print current thread id

The thread id is generated by Linux and can take values higher than 1-9, just like PIDs. This thread number is useful to know which function calls are issued by the same thread, avoiding confusion between threads.

#include <stdio.h>
#include <unistd.h>
#include <sys/syscall.h>

printf("%s [%d]\n", __PRETTY_FUNCTION__, syscall(SYS_gettid));
fflush(stdout);

Debug GStreamer thread locks

We redefine the GST_OBJECT_LOCK/UNLOCK/TRYLOCK macros to print the calls, compare locks against unlocks, and see who’s not releasing its lock:

#include "wtf/Threading.h"
#define GST_OBJECT_LOCK(obj) do { \
  printf("### [LOCK] %s [%p]\n", __PRETTY_FUNCTION__, &Thread::current()); fflush(stdout); \
  g_mutex_lock(GST_OBJECT_GET_LOCK(obj)); \
} while (0)
#define GST_OBJECT_UNLOCK(obj) do { \
  printf("### [UNLOCK] %s [%p]\n", __PRETTY_FUNCTION__, &Thread::current()); fflush(stdout); \
  g_mutex_unlock(GST_OBJECT_GET_LOCK(obj)); \
} while (0)
#define GST_OBJECT_TRYLOCK(obj) ({ \
  gboolean result = g_mutex_trylock(GST_OBJECT_GET_LOCK(obj)); \
  if (result) { \
   printf("### [LOCK] %s [%p]\n", __PRETTY_FUNCTION__, &Thread::current()); fflush(stdout); \
  } \
  result; \
})

Warning: The statement expression that allows the TRYLOCK macro to return a value will only work on GCC.

There’s a way to know which thread has taken a lock in glib/GStreamer using gdb. First locate the stalled thread:

(gdb) thread 
(gdb) bt
#2  0x74f07416 in pthread_mutex_lock ()
#3  0x7488aec6 in gst_pad_query ()
#4  0x6debebf2 in autoplug_query_allocation ()

(gdb) frame 3
#3  0x7488aec6 in gst_pad_query (pad=pad@entry=0x54a9b8, ...)
4058        GST_PAD_STREAM_LOCK (pad);

Now get the process id (PID) and use the pthread_mutex_t structure to print the Linux thread id that has acquired the lock:

(gdb) call getpid()
$30 = 6321
(gdb) p ((pthread_mutex_t*)pad.stream_rec_lock.p)->__data.__owner
$31 = 6368
(gdb) thread find 6321.6368
Thread 21 has target id 'Thread 6321.6368'

Trace function calls (poor developer version)

If you’re using C++, you can define a tracer class. This is for webkit, but you get the idea:

#define MYTRACER() MyTracer(__PRETTY_FUNCTION__);
class MyTracer {
public:
    MyTracer(const gchar* functionName)
      : m_functionName(functionName) {
      printf("### %s : begin %d\n", m_functionName.utf8().data(), currentThread()); fflush(stdout);
    }
    virtual ~MyTracer() {
        printf("### %s : end %d\n", m_functionName.utf8().data(), currentThread()); fflush(stdout);
    }
private:
    String m_functionName;
};

And use it like this in all the functions you want to trace:

void somefunction() {
  MYTRACER();
  // Some other code...
}

The constructor will log when the execution flow enters into the function and the destructor will log when the flow exits.

Setting breakpoints from C

In the C code, just call raise(SIGINT) (simulate CTRL+C, normally the program would finish).

And then, in a previously attached gdb, after breaking and having debugging all you needed, just continue the execution by ignoring the signal or just plainly continuing:

(gdb) signal 0
(gdb) continue

There’s a way to do the same but attaching gdb after the raise. Use raise(SIGSTOP) instead (simulate CTRL+Z). Then attach gdb, locate the thread calling raise and switch to it:

(gdb) thread apply all bt
[now search for "raise" in the terminal log]
Thread 36 (Thread 1977.2033): #1 0x74f5b3f2 in raise () from /home/enrique/buildroot/output2/staging/lib/libpthread.so.0
(gdb) thread 36

Now, from a terminal, send a continuation signal: kill -SIGCONT 1977. Finally instruct gdb to single-step only the current thread (IMPORTANT!) and run some steps until all the raises have been processed:

(gdb) set scheduler-locking on
(gdb) next    // Repeat several times...

Know the name of a GStreamer function stored in a pointer at runtime

Just use this macro:

GST_DEBUG_FUNCPTR_NAME(func)

Detecting memory leaks in WebKit

RefCountedLeakCounter is a tool class that can help to debug reference leaks by printing this kind of messages when WebKit exits:

  LEAK: 2 XMLHttpRequest
  LEAK: 25 CachedResource
  LEAK: 3820 WebCoreNode

To use it you have to modify the particular class you want to debug:

  • Include wtf/RefCountedLeakCounter.h
  • DEFINE_DEBUG_ONLY_GLOBAL(WTF::RefCountedLeakCounter, myClassCounter, ("MyClass"));
  • In the constructor: myClassCounter.increment()
  • In the destructor: myClassCounter.decrement()

GStreamer WebKit debugging by instrumenting source code (1/3)

This is the continuation of the GStreamer WebKit debugging tricks post series. In the next three posts, I’ll focus on what we can get by doing some little changes to the source code for debugging purposes (known as “instrumenting”), but before, you might want to check the previous posts of the series:

Know all the env vars read by a program by using LD_PRELOAD to intercept libc calls

// File getenv.c
// To compile: gcc -shared -Wall -fPIC -o getenv.so getenv.c -ldl
// To use: export LD_PRELOAD="./getenv.so", then run any program you want
// See http://www.catonmat.net/blog/simple-ld-preload-tutorial-part-2/

#define _GNU_SOURCE

#include <stdio.h>
#include <dlfcn.h>

// This function will take the place of the original getenv() in libc
char *getenv(const char *name) {
 printf("Calling getenv(\"%s\")\n", name);

 char *(*original_getenv)(const char*);
 original_getenv = dlsym(RTLD_NEXT, "getenv");

 return (*original_getenv)(name);
}

See the breakpoints with command example to know how to get the same using gdb. Check also Zan’s libpine for more features.

Track lifetime of GObjects by LD_PRELOADing gobject-list

The gobject-list project, written by Thibault Saunier, is a simple LD_PRELOAD library for tracking the lifetime of GObjects. When loaded into an application, it prints a list of living GObjects on exiting the application (unless the application crashes), and also prints reference count data when it changes. SIGUSR1 or SIGUSR2 can be sent to the application to trigger printing of more information.

Overriding the behaviour of a debugging macro

The usual debugging macros aren’t printing messages? Redefine them to make what you want:

#undef LOG_MEDIA_MESSAGE
#define LOG_MEDIA_MESSAGE(...) do { \
  printf("LOG %s: ", __PRETTY_FUNCTION__); \
  printf(__VA_ARGS__); \
  printf("\n"); \
  fflush(stdout); \
} while(0)

This can be done to enable asserts on demand in WebKit too:

#undef ASSERT
#define ASSERT(assertion) \
  (!(assertion) ? \
      (WTFReportAssertionFailure(__FILE__, __LINE__, WTF_PRETTY_FUNCTION, #assertion), \
       CRASH()) : \
      (void)0)

#undef ASSERT_NOT_REACHED
#define ASSERT_NOT_REACHED() do { \
  WTFReportAssertionFailure(__FILE__, __LINE__, WTF_PRETTY_FUNCTION, 0); \
  CRASH(); \
} while (0)

It may be interesting to enable WebKit LOG() and GStreamer GST_DEBUG() macros only on selected files:

#define LOG(channel, msg, ...) do { \
  printf("%s: ", #channel); \
  printf(msg, ## __VA_ARGS__); \
  printf("\n"); \
  fflush(stdout); \
} while (false)

#define _GST_DEBUG(msg, ...) do { \
  printf("### %s: ", __PRETTY_FUNCTION__); \
  printf(msg, ## __VA_ARGS__); \
  printf("\n"); \
  fflush(stdout); \
} while (false)

Note all the preprocessor trickery used here:

  • First arguments (channel, msg) are captured intependently
  • The remaining args are captured in __VA_ARGS__
  • do while(false) is a trick to avoid {braces} and make the code block work when used in if/then/else one-liners
  • #channel expands LOG(MyChannel,....) as printf("%s: ", "MyChannel"). It’s called “stringification”.
  • ## __VA_ARGS__ expands the variable argument list as a comma-separated list of items, but if the list is empty, it eats the comma after “msg”, preventing syntax errors

Print the compile-time type of an expression

Use typeid(<expression>).name(). Filter the ouput through c++filt -t:

std::vector<char *> v; 
printf("Type: %s\n", typeid(v.begin()).name());

Abusing the compiler to know all the places where a function is called

If you want to know all the places from where the GstClockTime toGstClockTime(float time) function is called, you can convert it to a template function and use static_assert on a wrong datatype like this (in the .h):

template <typename T = float> GstClockTime toGstClockTime(float time) { 
  static_assert(std::is_integral<T>::value,
    "Don't call toGstClockTime(float)!");
  return 0;
}

Note that T=float is different to integer (is_integral). It has nothing to do with the float time parameter declaration.

You will get compile-time errors like this on every place the function is used:

WebKitMediaSourceGStreamer.cpp:474:87:   required from here
GStreamerUtilities.h:84:43: error: static assertion failed: Don't call toGstClockTime(float)!

Use pragma message to print values at compile time

Sometimes is useful to know if a particular define is enabled:

#include <limits.h>

#define _STR(x) #x
#define STR(x) _STR(x)

#pragma message "Int max is " STR(INT_MAX)

#ifdef WHATEVER
#pragma message "Compilation goes by here"
#else
#pragma message "Compilation goes by there"
#endif

...

The code above would generate this output:

test.c:6:9: note: #pragma message: Int max is 0x7fffffff
 #pragma message "Int max is " STR(INT_MAX)
         ^~~~~~~
test.c:11:9: note: #pragma message: Compilation goes by there
 #pragma message "Compilation goes by there"
         ^~~~~~~

GStreamer WebKit debugging tricks using GDB (2/2)

This post is a continuation of a series of blog posts about the most interesting debugging tricks I’ve found while working on GStreamer WebKit on embedded devices. These are the other posts of the series published so far:

Print corrupt stacktraces

In some circumstances you may get stacktraces that eventually stop because of missing symbols or corruption (?? entries).

#3  0x01b8733c in ?? ()
Backtrace stopped: previous frame identical to this frame (corrupt stack?)

However, you can print the stack in a useful way that gives you leads about what was next in the stack:

  • For i386: x/256wa $esp
  • For x86_64: x/256ga $rsp
  • For ARM 32 bit: x/256wa $sp

You may want to enable asm-demangle: set print asm-demangle

Example output, the 3 last lines give interesting info:

0x7ef85550:     0x1b87400       0x2     0x0     0x1b87400
0x7ef85560:     0x0     0x1b87140       0x1b87140       0x759e88a4
0x7ef85570:     0x1b87330       0x759c71a9 <gst_base_sink_change_state+956>     0x140c  0x1b87330
0x7ef85580:     0x759e88a4      0x7ef855b4      0x0     0x7ef855b4
...
0x7ef85830:     0x76dbd6c4 <WebCore::AppendPipeline::resetPipeline()::__PRETTY_FUNCTION__>        0x4     0x3     0x1bfeb50
0x7ef85840:     0x0     0x76d59268      0x75135374      0x75135374
0x7ef85850:     0x76dbd6c4 <WebCore::AppendPipeline::resetPipeline()::__PRETTY_FUNCTION__>        0x1b7e300       0x1d651d0       0x75151b74

More info: 1

Sometimes the symbol names aren’t printed in the stack memdump. You can do this trick to iterate the stack and print the symbols found there (take with a grain of salt!):

(gdb) set $i = 0
(gdb) p/a *((void**)($sp + 4*$i++))

[Press ENTER multiple times to repeat the command]

$46 = 0xb6f9fb17 <_dl_lookup_symbol_x+250>
$58 = 0xb40a9001 <g_log_writer_standard_streams+128>
$142 = 0xb40a877b <g_return_if_fail_warning+22>
$154 = 0xb65a93d5 <WebCore::MediaPlayerPrivateGStreamer::changePipelineState(GstState)+180>
$164 = 0xb65ab4e5 <WebCore::MediaPlayerPrivateGStreamer::playbackPosition() const+420>
...

Many times it’s just a matter of gdb not having loaded the unstripped version of the library. /proc/<PID>/smaps and info proc mappings can help to locate the library providing the missing symbol. Then we can load it by hand.

For instance, for this backtrace:

#0  0x740ad3fc in syscall () from /home/enrique/buildroot-wpe/output/staging/lib/libc.so.6 
#1  0x74375c44 in g_cond_wait () from /home/enrique/buildroot-wpe/output/staging/usr/lib/libglib-2.0.so.0 
#2  0x6cfd0d60 in ?? ()

In a shell, we examine smaps and find out that the unknown piece of code comes from libgstomx:

$ cat /proc/715/smaps
...
6cfc1000-6cff8000 r-xp 00000000 b3:02 785380     /usr/lib/gstreamer-1.0/libgstomx.so
...

Now we load the unstripped .so in gdb and we’re able to see the new symbol afterwards:

(gdb) add-symbol-file /home/enrique/buildroot-wpe/output/build/gst-omx-custom/omx/.libs/libgstomx.so 0x6cfc1000
(gdb) bt
#0  0x740ad3fc in syscall () from /home/enrique/buildroot-wpe/output/staging/lib/libc.so.6
#1  0x74375c44 in g_cond_wait () from /home/enrique/buildroot-wpe/output/staging/usr/lib/libglib-2.0.so.0
#2  0x6cfd0d60 in gst_omx_video_dec_loop (self=0x6e0c8130) at gstomxvideodec.c:1311
#3  0x6e0c8130 in ?? ()

Useful script to prepare the add-symbol-file:

cat /proc/715/smaps | grep '[.]so' | sed -e 's/-[0-9a-f]*//' | { while read ADDR _ _ _ _ LIB; do echo "add-symbol-file $LIB 0x$ADDR"; done; }

More info: 1

The “figuring out corrupt ARM stacktraces” post has some additional info about how to use addr2line to translate memory addresses to function names on systems with a hostile debugging environment.

Debugging a binary without debug symbols

There are times when there’s just no way to get debug symbols working, or where we’re simply debugging on a release version of the software. In those cases, we must directly debug the assembly code. The gdb text user interface (TUI) can be used to examine the disassebled code and the CPU registers. It can be enabled with these commands:

layout asm
layout regs
set print asm-demangle

Some useful keybindings in this mode:

  • Arrows: scroll the disassemble window
  • CTRL+p/n: Navigate history (previously done with up/down arrows)
  • CTRL+b/f: Go backward/forward one character (previously left/right arrows)
  • CTRL+d: Delete character (previously “Del” key)
  • CTRL+a/e: Go to the start/end of the line

This screenshot shows how we can infer that an empty RefPtr is causing a crash in some WebKit code.

Wake up an unresponsive gdb on ARM

Sometimes, when you continue (‘c’) execution on ARM there’s no way to stop it again unless a breakpoint is hit. But there’s a trick to retake the control: just send a harmless signal to the process.

kill -SIGCONT 1234

Know which GStreamer thread id matches with each gdb thread

Sometimes you need to match threads in the GStreamer logs with threads in a running gdb session. The simplest way is to ask it to GThread for each gdb thread:

(gdb) set output-radix 16
(gdb) thread apply all call g_thread_self()

This will print a list of gdb threads and GThread*. We only need to find the one we’re looking for.

Generate a pipeline dump from gdb

If we have a pointer to the pipeline object, we can call the function that dumps the pipeline:

(gdb) call gst_debug_bin_to_dot_file_with_ts((GstBin*)0x15f0078, GST_DEBUG_GRAPH_SHOW_ALL, "debug")

GStreamer WebKit debugging tricks using GDB (1/2)

I’ve been developing and debugging desktop and mobile applications on embedded devices over the last decade or so. The main part of this period I’ve been focused on the multimedia side of the WebKit ports using GStreamer, an area that is a mix of C (glib, GObject and GStreamer) and C++ (WebKit).

Over these years I’ve had to work on ARM embedded devices (mobile phones, set-top-boxes, Raspberry Pi using buildroot) where most of the environment aids and tools we take for granted on a regular x86 Linux desktop just aren’t available. In these situations you have to be imaginative and find your own way to get the work done and debug the issues you find in along the way.

I’ve been writing down the most interesting tricks I’ve found in this journey and I’m sharing them with you in a series of 7 blog posts, one per week. Most of them aren’t mine, and the ones I learnt in the begining of my career can even seem a bit naive, but I find them worth to share anyway. I hope you find them as useful as I do.

Breakpoints with command

You can break on a place, run some command and continue execution. Useful to get logs:

break getenv
command
 # This disables scroll continue messages
 # and supresses output
 silent
 set pagination off
 p (char*)$r0
continue
end

break grl-xml-factory.c:2720 if (data != 0)
command
 call grl_source_get_id(data->source)
 # $ is the last value in the history, the result of
 # the previous call
 call grl_media_set_source (send_item->media, $)
 call grl_media_serialize_extended (send_item->media, 
  GRL_MEDIA_SERIALIZE_FULL)
 continue
end

This idea can be combined with watchpoints and applied to trace reference counting in GObjects and know from which places the refcount is increased and decreased.

Force execution of an if branch

Just wait until the if chooses a branch and then jump to the other one:

6 if (i > 3) {
(gdb) next
7 printf("%d > 3\n", i);
(gdb) break 9
(gdb) jump 9
9 printf("%d <= 3\n", i);
(gdb) next
5 <= 3

Debug glib warnings

If you get a warning message like this:

W/GLib-GObject(18414): g_object_unref: assertion `G_IS_OBJECT (object)' failed

the functions involved are: g_return_if_fail_warning(), which calls to g_log(). It’s good to set a breakpoint in any of the two:

break g_log

Another method is to export G_DEBUG=fatal_criticals, which will convert all the criticals in crashes, which will stop the debugger.

Debug GObjects

If you want to inspect the contents of a GObjects that you have in a reference…

(gdb) print web_settings 
$1 = (WebKitWebSettings *) 0x7fffffffd020

you can dereference it…

(gdb) print *web_settings
$2 = {parent_instance = {g_type_instance = {g_class = 0x18}, ref_count = 0, qdata = 0x0}, priv = 0x0}

even if it’s an untyped gpointer…

(gdb) print user_data
(void *) 0x7fffffffd020
(gdb) print *((WebKitWebSettings *)(user_data))
{parent_instance = {g_type_instance = {g_class = 0x18}, ref_count = 0, qdata = 0x0}, priv = 0x0}

To find the type, you can use GType:

(gdb) call (char*)g_type_name( ((GTypeInstance*)0x70d1b038)->g_class->g_type )
$86 = 0x2d7e14 "GstOMXH264Dec-omxh264dec"

Instantiate C++ object from gdb

(gdb) call malloc(sizeof(std::string))
$1 = (void *) 0x91a6a0
(gdb) call ((std::string*)0x91a6a0)->basic_string()
(gdb) call ((std::string*)0x91a6a0)->assign("Hello, World")
$2 = (std::basic_string<char, std::char_traits<char>, std::allocator<char> > &) @0x91a6a0: {static npos = <optimized out>, _M_dataplus = {<std::allocator<char>> = {<__gnu_cxx::new_allocator<char>> = {<No data fields>}, <No data fields>}, _M_p = 0x91a6f8 "Hello, World"}}
(gdb) call SomeFunctionThatTakesAConstStringRef(*(const std::string*)0x91a6a0)

See: 1 and 2